Transcription factors (TFs) bind to enhancers in a cooperative manner and then trigger gene transcription. Exploring how TF binds to DNA with the context of other partners and how TF cooperates with each other is critical to understand cis-regulatory code and study the mechanism underlying transcription regulation.
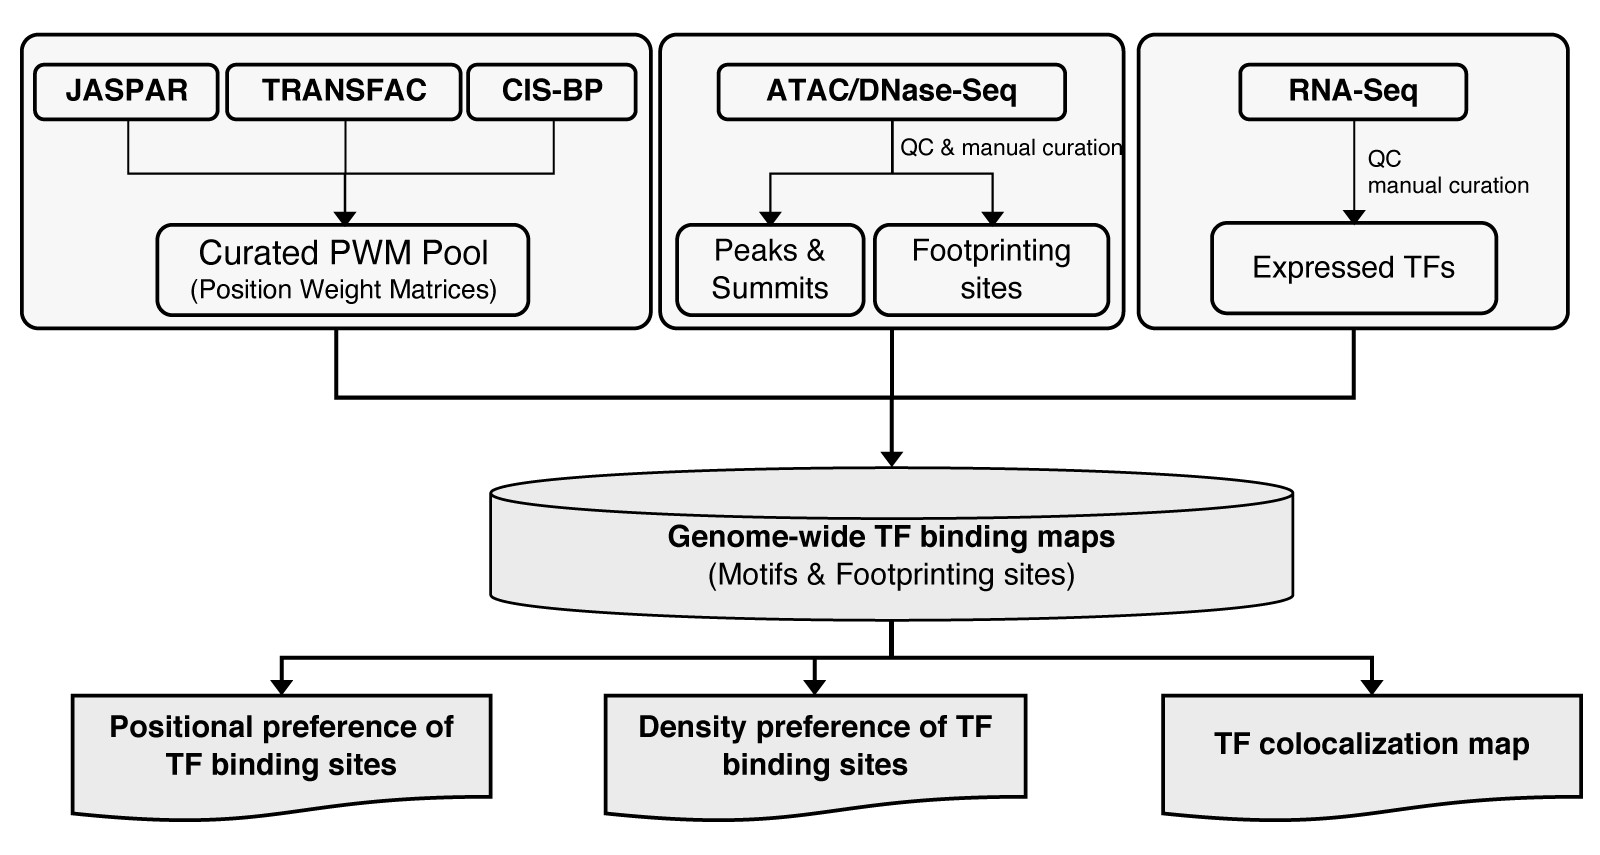
TFSyntax is a database of transcription factor binding syntax. Besides genome-wide TF binding profile in different human and mouse samples, TFSyntax also presents the binding syntax in terms of TF positional preference, density preference and TF colocalization map within regulatory elements. Both motifs or footprinting data were used to explore TF binding syntax. Users can browse and download all these data, and make comparison analysis with online tool.
Different TFs display positional binding preferences within enhancers. Specifically, relative binding position of a specific TF could be classified roughly into three major groups: center enriched, evenly distributed, and center depleted. Meanwhile, there may be several subgroups in each major group. These patterns may reflect TF-specific intrinsic structural or functional characteristics (PMID: 29987030). In TFSyntax, the positional profile of different TFs were calculated relative to the summit of regulatory elements based on motif or footprinting data.
Some TFs may bind to elements with relatively few partners, while some may prefer more overcrowded elements (on which many TFs may bind). In TFSyntax, TF density preference was presented in two ways: 1) distribution of partner number on the same summit; 2) mean and standard deviation of partner number.
TF colocalization map is a matrix showing how each TF colocalize with each other. Specifically, TFs on the row and column are from the same list. Score on each grid shows that what percentage of TF on the row was colocalized by the TF on the column.
"Stripe" factors are a group of transcription factors who frequently colocalize with many other factors. In the study, if more than 10% of elements with TF A also harbor TF B, and then we defined that TF A was colocalized by TF B. If TF B colocalizes with over 30% of TFs in a cell type, we named TF B as stripe factors. On the clustered TF colocalization map, we can see a clear stripe on column where the factor locates. Our recent study shows that “stripe” factors provide accessibility to co-binding partners in mammalian genomes.
We collected PWMs from JASPAR, cisBP and TRANSFAC (commercial version) with manual curation. PWM hits were identified with fimo. In each sample, we used RNA-Seq to filter out silent TFs, and ATAC-Seq and DNase-Seq data to filter out PWM hits outside the summit regions (201bp) of regulatory elements.
In all analysis, we used the summits of regulatory elements for analysis. Specifically, we extended each summit both upstream and downstream by 100bp, which resulted a 201bp-region (extended summit region). The annotation of potential TF binding around summits are based on the extended summit regions.
We can identify such kind information from the sample ID. Sample IDs are shown as format like: hsATAC2068, mmDHS3301. If there is "ATAC" in a sample ID, it means that the sample is from ATAC-Seq. While if there is "DHS" in the sample ID, it means that the sample is from DNase-Seq.
Users can browse TF binding syntax by the list of TFs shown as "Browse By Factor" in the navigation header, or by searching specific TF with the online search module on the home page or "TF Colocalization Map" in the navigation header.
Yes or No. For analysis, Yes. Users can load their own data to the genome browserl, but the data will **NOT** be uploaded to our server. Therefore, your data will be always private. The only prerequisite is that the file(s) should be based on the same reference genome.
For human, we are using hg38, while mm10 is used for mouse.
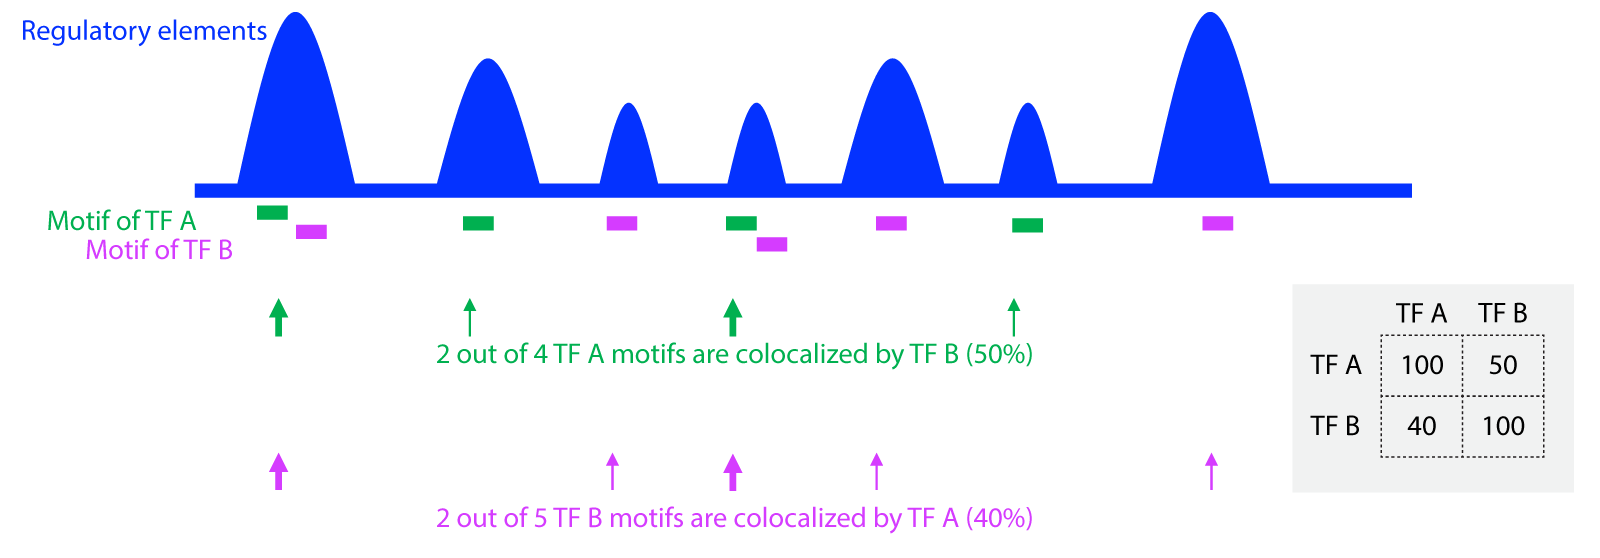
In a tissue/cell type, based on the map of TF motifs within extended summits (201bp), we calculated the percentage of TF A motifs colocalized by TF B, and the value is 50%. Similarly, we calculated the percentage of TF B motifs colocalized by TF A, with a percentage of 40%. The scores in the heatmap (TF Colocalization Map) present the percentage of TFs on Y-axis (each row) colocalized by TFs on X-axis (each column).
Yes. This is the link for source code as well as test data: https://github.com/zhaopage/tfsyntax.
The short answer is that it is a good practice to check both motif-based and footprinting-based results, because they tend to complement each other. On the one hand, motif-based data are much more comprehensive, but a perfect DNA motif might not be bound by the cognate TF in vivo. Therefore, motif-based data may be overrepresented. On the other hand, past studies have shown that TF footprints are not detectable for proteins that bind very transiently to chromatin (PMID: 24317252, 25242143, 26914206). Therefore, footprinting-based data tends to underestimate TF binding.
All comments and questions are welcome. Please contact with  .
.
© TFSyntax 2026. This application is designed & developed by Yongbing Zhao.